To Blink or How not to Blink?
/ Industrial Engineering /
In this post, author Laszlo Szabo shows us the importance of counting fraction of a second in Work Study. The fraction of second we are talking about is as low as a single blink.
As a person and as a company, we are forced to step in new competitions where the price and trust are the main criteria to win. The technology supports the globalization, with no borders and fast shipping, which allow us to change our roles between client and supplier many times per day.
The cost-based pricing is no more valid in the fast running apparel sector. Instead of it, the “price-based costing” is compulsory. It’s a part of the client-drive game, based on the affordable multi-dimensional supply chain.
How long does it take a blink?
The scientists measured 100 – 400 milliseconds for the duration of a blink, for easy comparing 300 milliseconds (0.005 minutes) will be considered in this analysis. Is it much or is it few this 0.005 minute? In case of the mayfly with a lifetime of a few hours, this is very much but in the case of a turtle or a human?
Let’s consider garment operations. In the following examples, we will see the cost of cumulation of blinks.
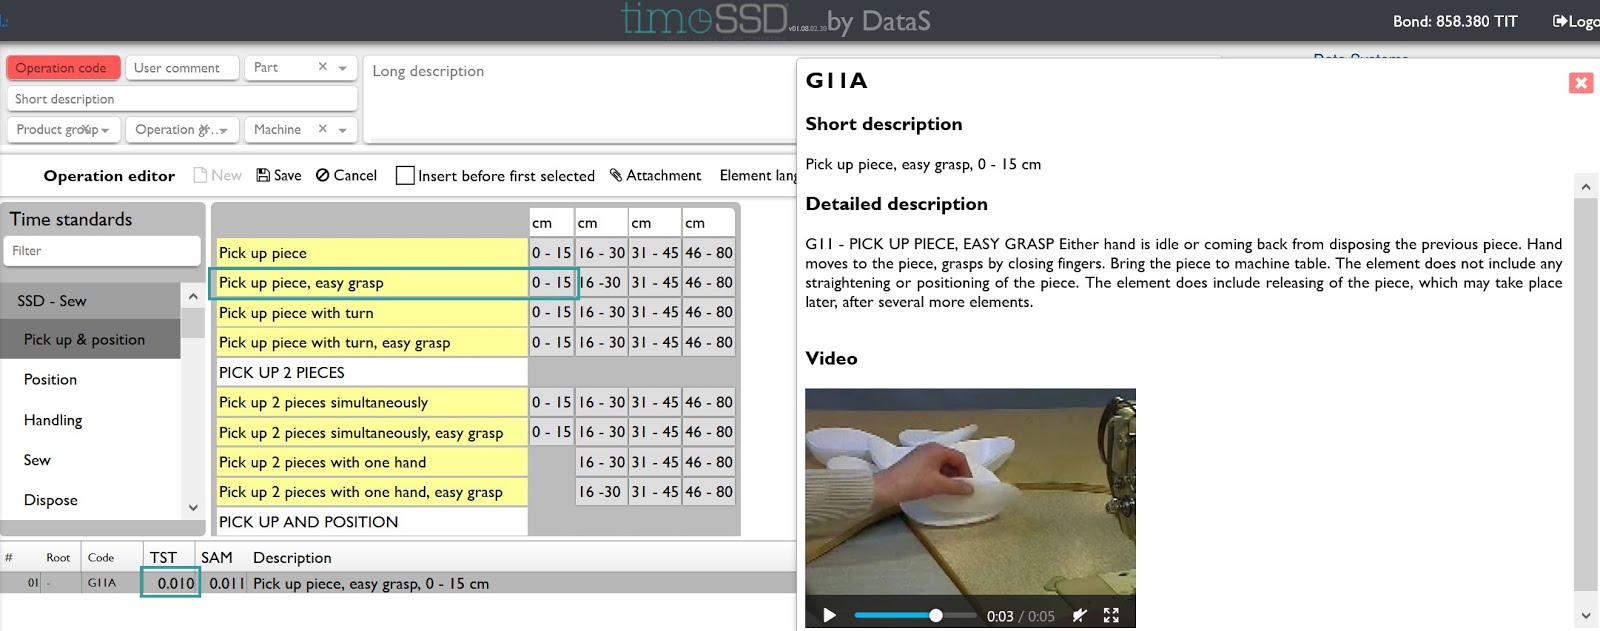
You know, each garment operation includes the catch (grasp) of one or more pieces as part of the method (operation cycle). Here two motions are shown in one motion
- Pick up the part with easy grasp and
- Pick up with (not easy) grasp.
Motion A
Pick up with easy grasp. Just close the fingers and pick up the piece, bring to the table and release it.
Standard time: 0.010 min
Motion B
Pick up with (not an easy) grasp
Standard time: 0.015 min
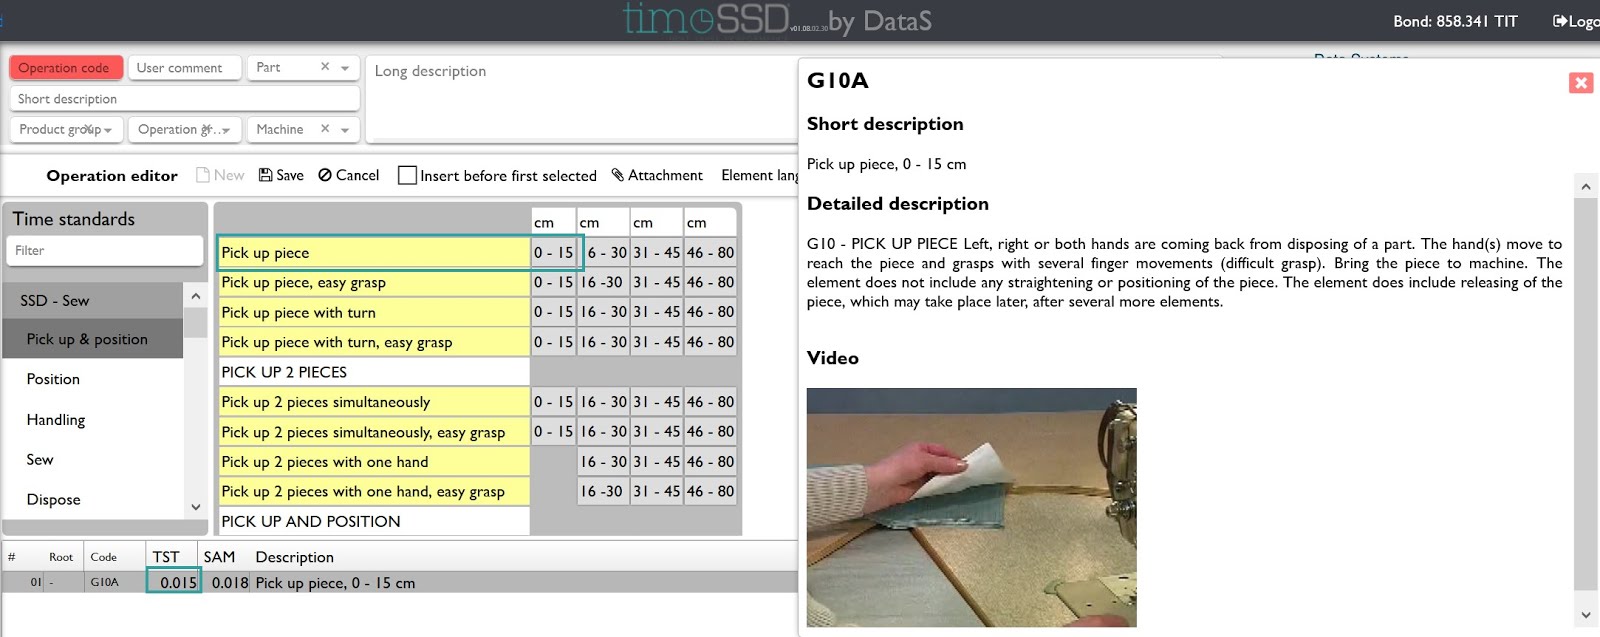
Grasp with several finger movements and pick up the piece, bring to the table and release it.
Depending on the material type and workplace could be necessary the motion A or the motion B.
The motion B has with 0.005 min higher standard time than motion A. The difference is the duration of a blink. The number is so small that we have the temptation to consider it as insignificant. This perception is right if is the case of only one motion.
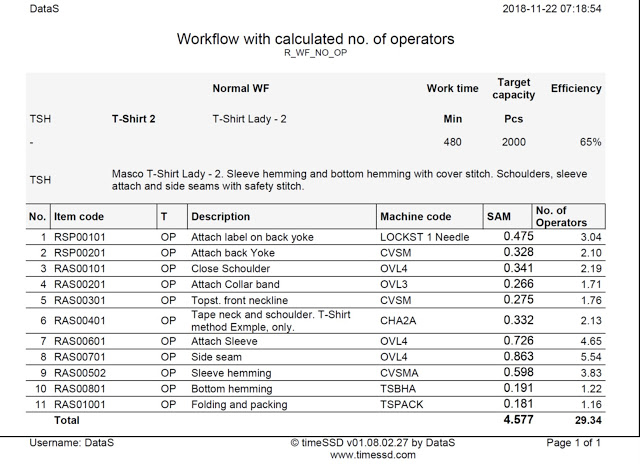
The table below shows the results with only one blink duration in plus, on each operation, on a product. Motion A and B are used only for tangible example, the focus is on the perceived difference as a very small number.
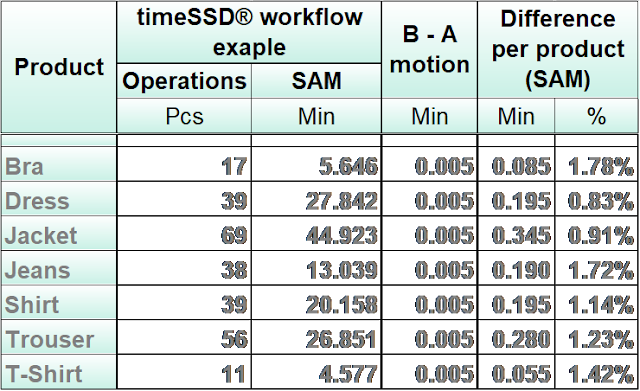
The cost of an unnecessary blink
An unnecessary blink length in plus on each operation generates in average a 1,11% higher SAM / SMV for a style.
In the case of the price-based costing, this means 1.11% allowed but unnecessary cost.
In case of a 10,000 pieces (ten thousand) order are allowed to miss 111 pieces, with the ordered quantity of 100,000 pieces the agreed minus is 1,111 pieces.
For example, a company with 800 employees accepts – known or unknown – a yearly turnover loss of more than 120,000 USD.
Accuracy matters!
The example has the intention to focus on the importance of the accuracy of the defined method. The used motions are arbitrary, only to provide interpretable figures regarding the level of influence of the motion analysis technics.
When someone is questioned about the inaccuracy of standard time, following remarks are made by industrial engineers (in the visited companies over the years).
- No time to develop standard methods, the deadlines are short, the order must start
- We miss the right engineers
- Our estimated values couldn’t generate relevant differences but saves time, effort and investment
- Is more easier and faster to use the SAM from my own Excel database
Are these reasons acceptable by the company management? It could be, in a case of a small order which don’t has any relevance in the global figure.
Think upside down! Where is it North?
We learned that North is upside on the maps … but sometimes the GPS turns the maps for our convenience.
Each company keeps the efficiency records, maybe detailed on individual level, even in case that no piecework payment is in use. The efficiency indicator in case of the piecework is as sensible as it simple seems.
Efficiency % = (Total SAM from executed operations / Total time used for execution)
Both time parameters are fastidious in practice, as the experience demonstrated. Excepting the real time systems, with on-line data collection terminals on each workplace, the time dedicated for operations execution is only approximated, in the best case with +/- 2%. I met companies where the time and attendance data are with -25% deviation. This value makes easy to report high efficiency.
In all cases the margin of error of the used execution time is settle to near a fix value during the time and based on the habit. It provides operable data for the efficiency figure, not the right one but with the known error for the insiders.
The SAM parameter generates more and unpredictable efficiency measurement errors, if isn’t used a PMTS results a series of wastes and losses.
First, the data for labor costing isn’t it accurate, but even the margin of error isn’t known. Sometimes the SAM established for a style could be much more than the benchmark and the order is got by the competitor. In other case could be significantly less with which the company generate losses and the number of pieces per time unit, expected from the workers, aren’t fair.
With the conditions of the price-based cost without PMTS, the labor costing figures could reach all the times the target value.
Without benchmark times all order planning activities includes from the start three error sources, which combined, generates an exponentially increasing error value. As results the target never reached, the deadlines are missed, the workers aren’t motivated, the costs are growing to an unpredictable level, the way the company goes is opposite to the lean.
The SAM established on a classic way, with a chronometer, consumes high and expensive specialists resources and has a lack with the very summary definition of the methods. The time could be the benchmark time, but the description of the method isn’t it detailed on the required level for easy learning by the operator.
The big part of the PMTS used in the apparel industry are based on MTM-2 elements, the measured deviation of the MTM-2 is 5%. Only an unnecessary blink duration included in each operation has an average effect of 1.11% deviation in case of a style.
The measurement of the operation execution time has a minimum of 2.00% deviation. Already the above minimal figures generate a default 8.29% deviation for the measured efficiency which could be considered as a thing what no company can really influence.
The target for each factory should be to keep under control the rest of the deviation generators with the aim to tend towards zero.
Finally, without a PMTS, the measured efficiency indicator could get a value inside of a large – but limited – interval which best fit the purpose of the persons in charge with it. It could have some relevance inside the company by comparing historical data, but it means near nothing for the company’s competitiveness evaluation.
Why timeSSD PTMS?
In the price-based costing era the proper utilization of the resources – man and machine – is crucial. The accurate efficiency figures and the standard methods with engineered times are the ground for the production planning, including line balancing. Adding the statistical value of the “off standard” parameter, resulted from the historical data of the accidentally breaks, increase the accuracy of the planning and reduce the bottlenecks in the shop floor.
timeSSD® facilitates to plan the PMTS costs per style, as novelty feature for the industry. With its “pay per user” pricing model the PMTS is no more a major investment, the company pays only for the SAM resulted from the workflow of the selected style.
Fair concern to the resources, indeed.
Step forward
For a company with standard methods, universal accepted execution times and accurate performance indicators the next step is to raise the bar.
- Should target orders from higher brands and with more complex styles.
- Is recommended to open the manufacturing data files, sharing the methods and workflows with the Clients, negotiating with confidence and celerity.
- The collaborative initiative and the transparency will gain the clients trust.
timeSSD® supports these steps with integrated features, on more than ten languages, using a unique platform.
![]()
On request, only, we provide:.
- cost-effective timeSSD® user training, including motion analysis technics
- outsourced, remote, method development services
Think about – “In the blink of an eye everything can change.” (Zig Ziglar).
It deserves a free trial: register here for free
What is price-based costing
The apparel manufacturer has a relevant influence only on the labor cost. The level of the labor cost is between 60% – 90% in case of the outsourced manufacturing, depending on the workforce scarcity and technological know-how.
With the customer’s demand, the manufacturer’s lifebelt and profit source depend on the added value generated by manufacturing more products on lower cost but with respect for fairness. The change in the behavior of the operators and a new approach from the industrial engineers’ side for innovative processes are a must, they provide the added value from the shop floor.
The price-based costing is the engine for the innovation, the fuel for the standard methods and the driver for the production organization, in fact, it’s that necessary “bad” for productivity improvement.
Productivity = Methods x Efficiency x Utilization (Sakamoto S. 2010)
Without to step in deeper in the interpretation of the formula is evident the presence of the time factor in each parameter.
Small numbers vs Big values
“Measure it, to improve it!” – meaning of Lord Kelvin words.
In the productivity formula, any better parameter increases the final value by eliminating the waste and has the contribution to the lean.
As a customer we expect from our suppliers the compliance to accurate numbers but what are our criteria regarding our measurements?